
Financial operating systems for behavioral health.
We build the financial operating system owner-operators run on: a 13-week cash forecast, a weekly CFO email that says what happened and what to do next, and pricing built on real unit costs. From strategy to bookkeeping, month to month.
60 minutes with Josh. Three deliverables, $0, and you keep the analysis.
- → see cash 13 weeks ahead
- → build a 4-month reserve
- → choose exit vs. operate
- → price from real unit costs

We run a 13-week cash forecast, updated weekly, against a 4-month operating reserve target.
In past engagements: −5.2% → 10%+ operating margin over two years (therapeutic boarding school) $300K+ overhead reduced in the first three months (~$25M RTC) Results vary. See the case studies →
Who's watching your numbers?
Not prepping financial reports. We mean "here's what happened and what to do next." Most programs don't have that.
- Cash slips through the cracks.
- Payroll creeps, and nobody notices until it's bad.
- The bank balance is a lagging number; it tells you what already happened.
We offer behavioral-health-specific CFO support that fixes this, with no need for a full-time hire.
Often it isn't a cash problem. It's a timing problem.
Care is delivered in January, billed in February, and collected in April. That gap is the cash conversion cycle, and a weekly forecast shows it coming before it hurts.

Rising payroll isn't always bad news.
At one program we support, payroll costs rose 20% and leadership was about to take drastic action. Cost per client was steady. The weekly CFO report caught it first.

Not compliance. An operating system.
Immunize against volatility, predict cash, optimize unit economics, then run the rhythm with leadership every week.
Immunize against volatility.
Build the risk buffer: a four-month reserve (2 months cash + 2 months collectible A/R), so leaders decide from strength, not scarcity.
Predictability creates control.
A live 13-week cash forecast replaces reactive bank-balance checking, so payroll week holds fewer surprises.
Improve profit per service unit.
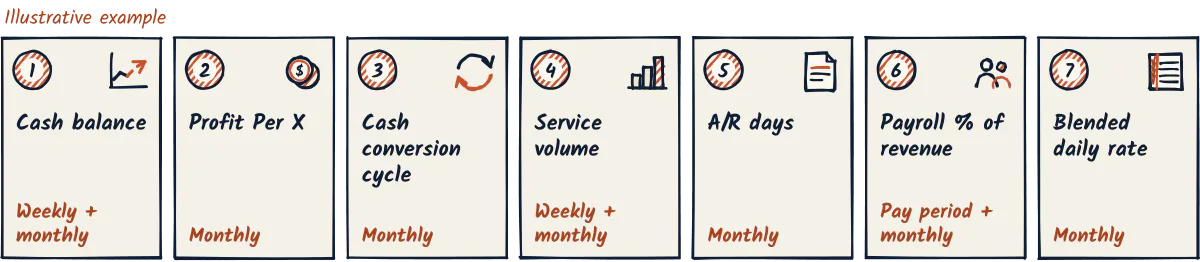
Work on Profit Per X through pricing, cost per service, service volume, and payor mix.
One system, one rhythm.
Connect tools, live dashboards, weekly actions, and monthly strategy into one operating rhythm.
We focus on profit per service unit, not just revenue.

Two anonymized engagements.
Summaries of real client work, with identifying details removed.

Willow Ridge Academy (pseudonym)
Leadership could not see why the program was losing money. Census-linked metrics, payroll-per-student visibility, new systems for bill pay, spend controls, and payroll/HR, and pricing based on true cost per treatment day moved the owner out of financial firefighting.
Identifying details anonymized. Margins are exact.
Red Mesa Behavioral Health (pseudonym)
The organization had outgrown its financial architecture. Decision-grade dashboards, a new chart of accounts, Ramp for bill pay, and census-driven department budgets followed, plus a one-time tax savings of over $100,000 from a change in tax reporting method.
Identifying details anonymized.
Results from individual engagements. Every organization is different, and past results don't guarantee future outcomes.
Three tiers, month to month.
Strategy, close, and day-to-day accounting from one behavioral-health-only team. Engage at the level you need today, then adjust as the business changes.
Fractional CFO
We own your financial strategy without a full-time hire.
- Fractional CFOStrategy, capital plan, board & investor reporting.
- Strategic AdvisoryVision facilitation, exit-readiness & deal support.
Includes the full MoneyMap Method
What's included →Fractional CFO for behavioral health →Controller
We close the books and own the accounting function.
- Fractional ControllerGAAP-aligned close, internal controls, audit-ready monthly.
- Outsourced AccountingEnd-to-end finance operations in one engagement.
Accounting Operations
We run the daily back office that keeps cash moving.
- BookkeepingBehavioral health chart of accounts, reconciliations, trend review.
- Accounts PayableApproval workflows, vendor management, spend control.
- Private-pay A/R managementWe manage private-pay accounts receivable on your behalf, as an extension of your in-house team: invoicing, payment reminders, and prepayment protocols. We don't handle insurance billing or claims.
- Payroll & TaxPayroll processing and tax compliance with an operator's lens.
Run a residential program or therapeutic boarding school? Financial leadership built for residential programs.
The Free Financial Systems Audit
A 60-minute working session with Josh. You keep all the analysis, even if we never work together. Pricing for any ongoing work is a custom quote after the audit.
Questions first? Email josh@bhealthcfo.com or Call Josh 435-429-2855.
Audit findings are preliminary and based on the information you share with us. The free audit doesn’t create an advisory or client relationship. Details
Josh or Tyler leads your onboarding, and Tyler leads your engagement day to day, with Josh involved in strategy.
- Your top 3 profit levers, quantified in dollars.
- A redlined P&L showing where margin is hiding.
- A 90-day sprint plan you can run with us, or without.